Today will be our last post of the first WaveCams Time-stack trilogy. We recommend to review our previous posts before starting (What is a time-stack? and the “Time Dimension”).
How do we know we can approach the beach safely? Intuitively, we know if the sea is agitated or not, it is easy to perceive the deafening noise of the waves or to notice the great amount of foam produced when big waves break!
All the above phenomena are coming from the same process of energy conversion: the bigger the wave, the more energy it carries and therefore the more noise and foam it generates.
The breaking of waves is conditioned by a close relationship between its height and the sea bed in the vicinity of the coast. Trying to summarize this interaction we could affirm the following:
- Bigger waves break at greater depth,
- The distance of the break relative to the coast is controlled by the slope of the beach,
- The more pronounced the slope, the closer the waves break and vice versa.
On the beach at Etretat, Normandy, West of France, the beach slope is quite steep and therefore the waves tend to break very close to the coast. Have a look at these videos corresponding to a winter storm and a local summer storm for example:
So we can use this physical relationship to estimate wave energy and height using the spatial dimension of our Time-stack. First we need to determine the size of the wave breaking zone, we do this by using an automated algorithm adapted from Andriolo et al. 2019 that allows us to identify three key points: the position where the waves start to break, their midpoint and the midline of the coast (green, red and blue represented in the following gif). With these three points it is possible to associate the extension of the breaking zone to the height of the waves.
In the following animations we show how this technique is used to determine wave height for the two events shown in the previous video.

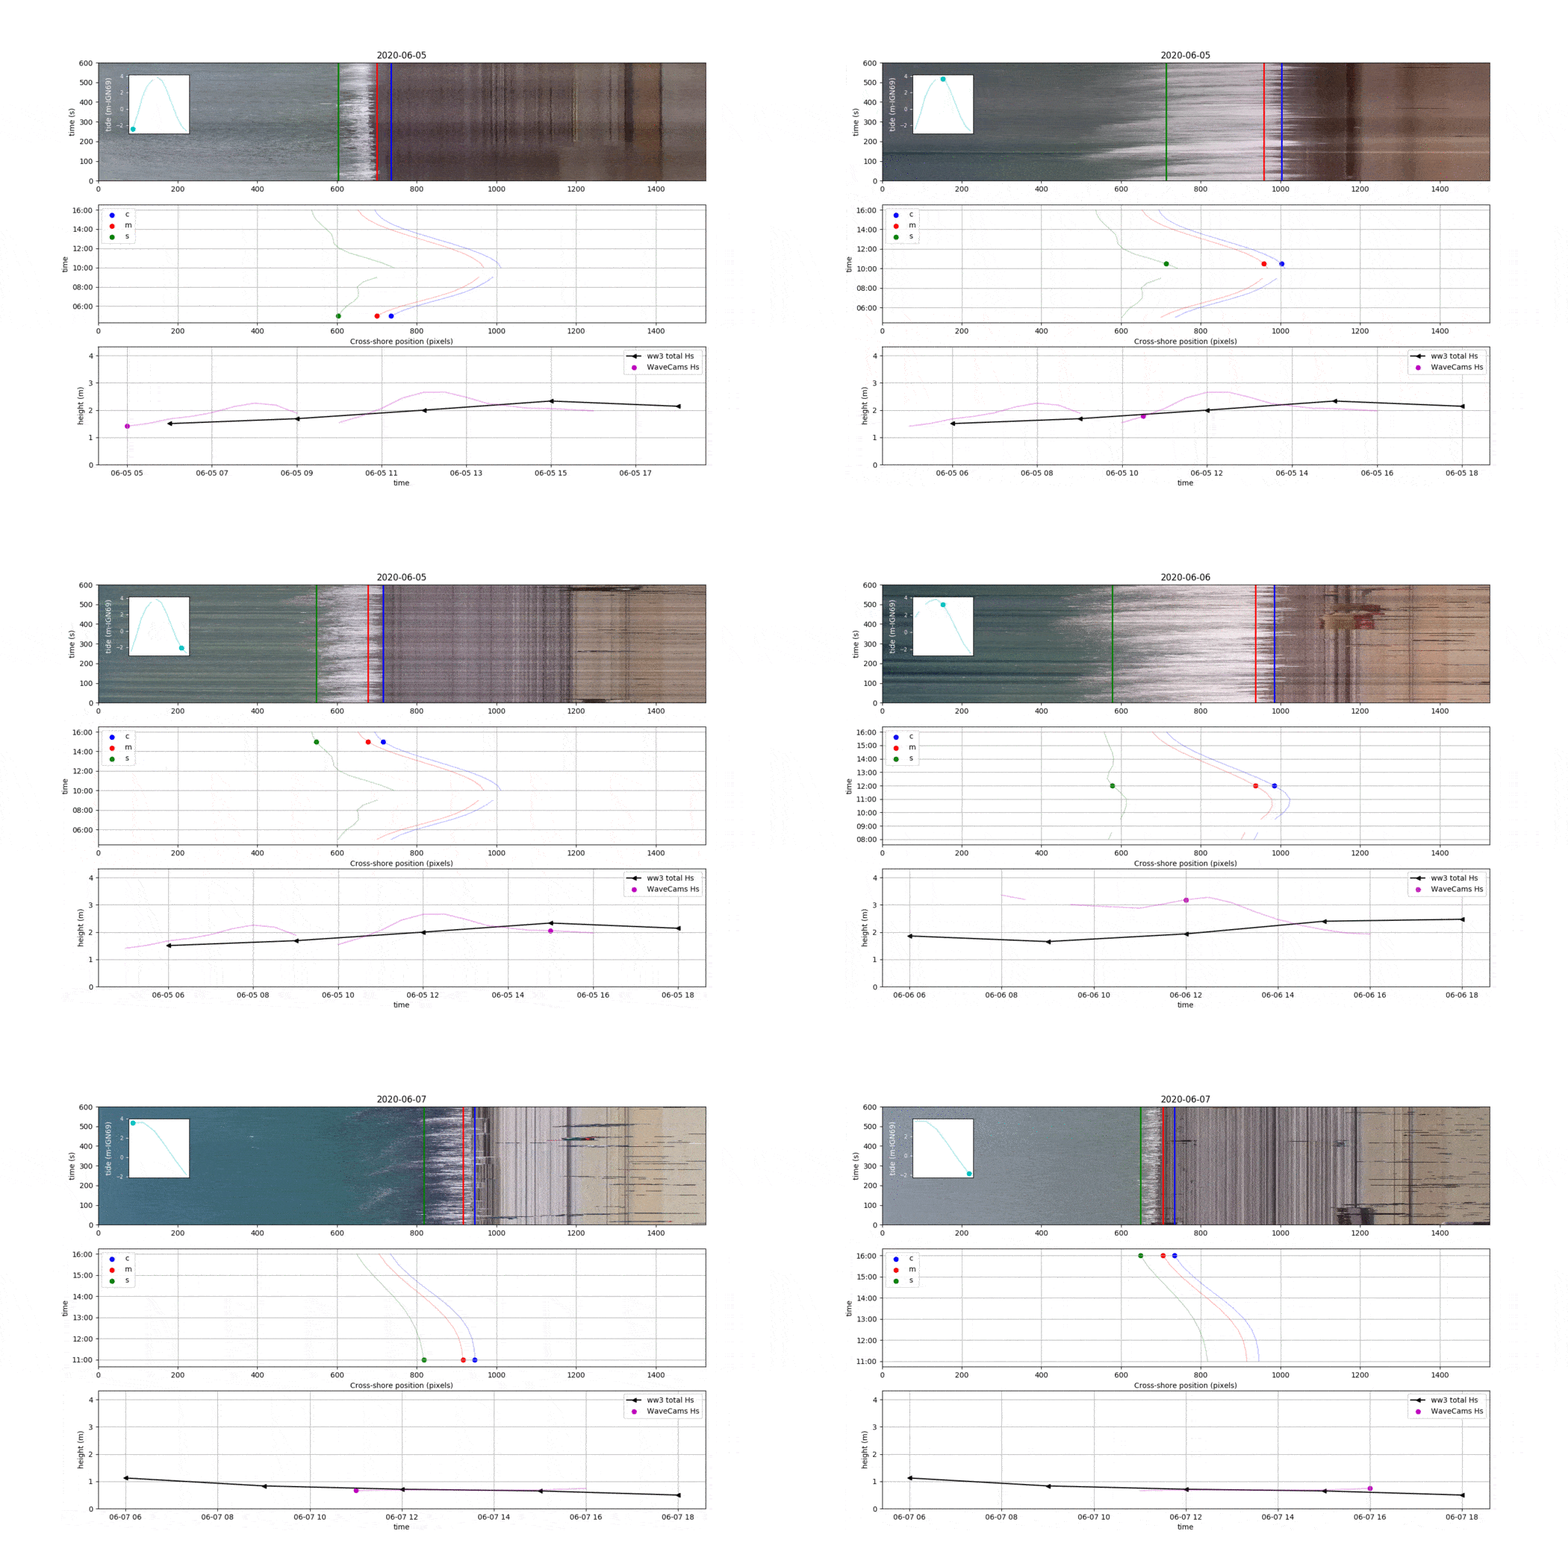
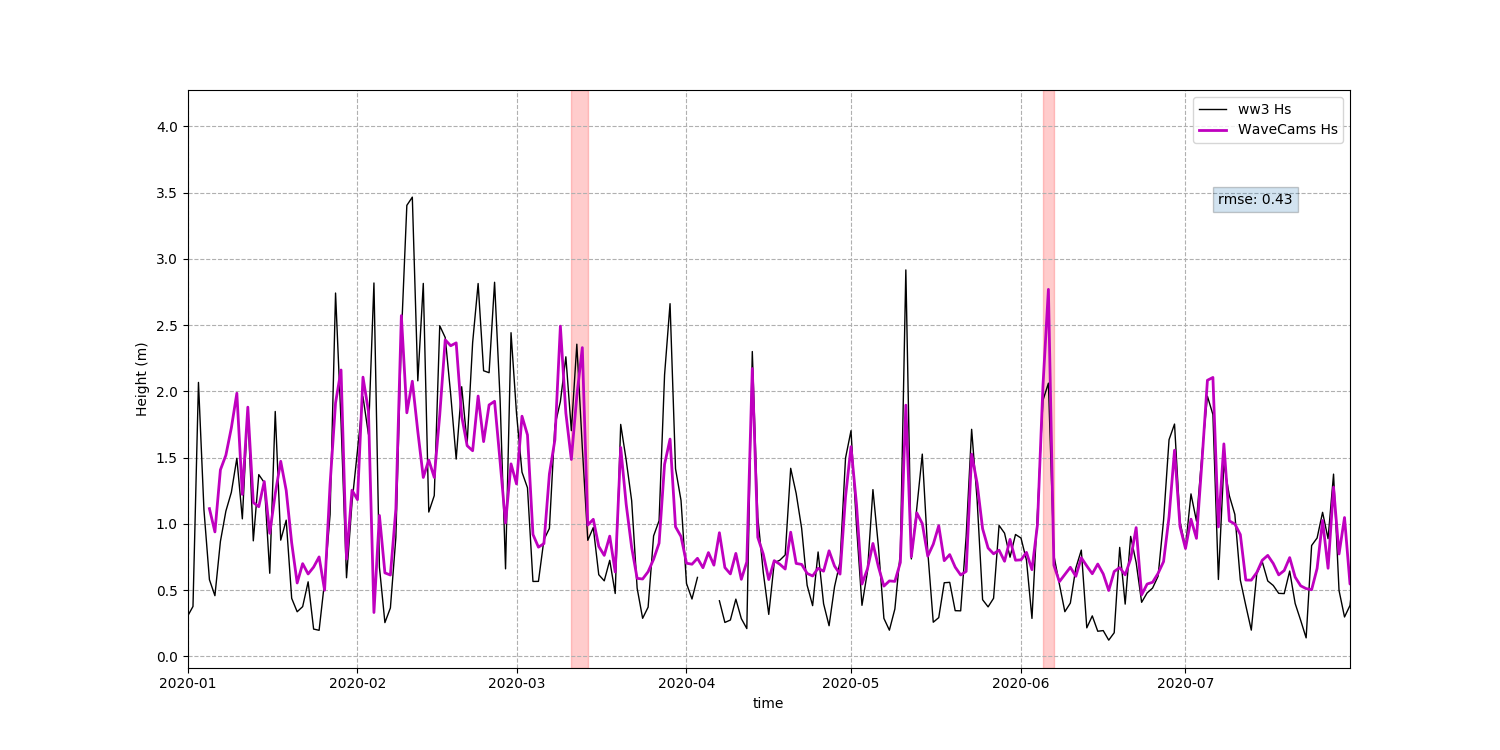
The height measurement is compared to the significant wave height of the ww3 model. It is interesting to note that while the trends seem globally similar, the heights may differ due to local conditions.
As with the wave period, with the fully operational WaveCams® tool it is possible to monitor wave height in the long term. On the following graph we can see an example of a time series for the first half of 2020 in Etretat, France.
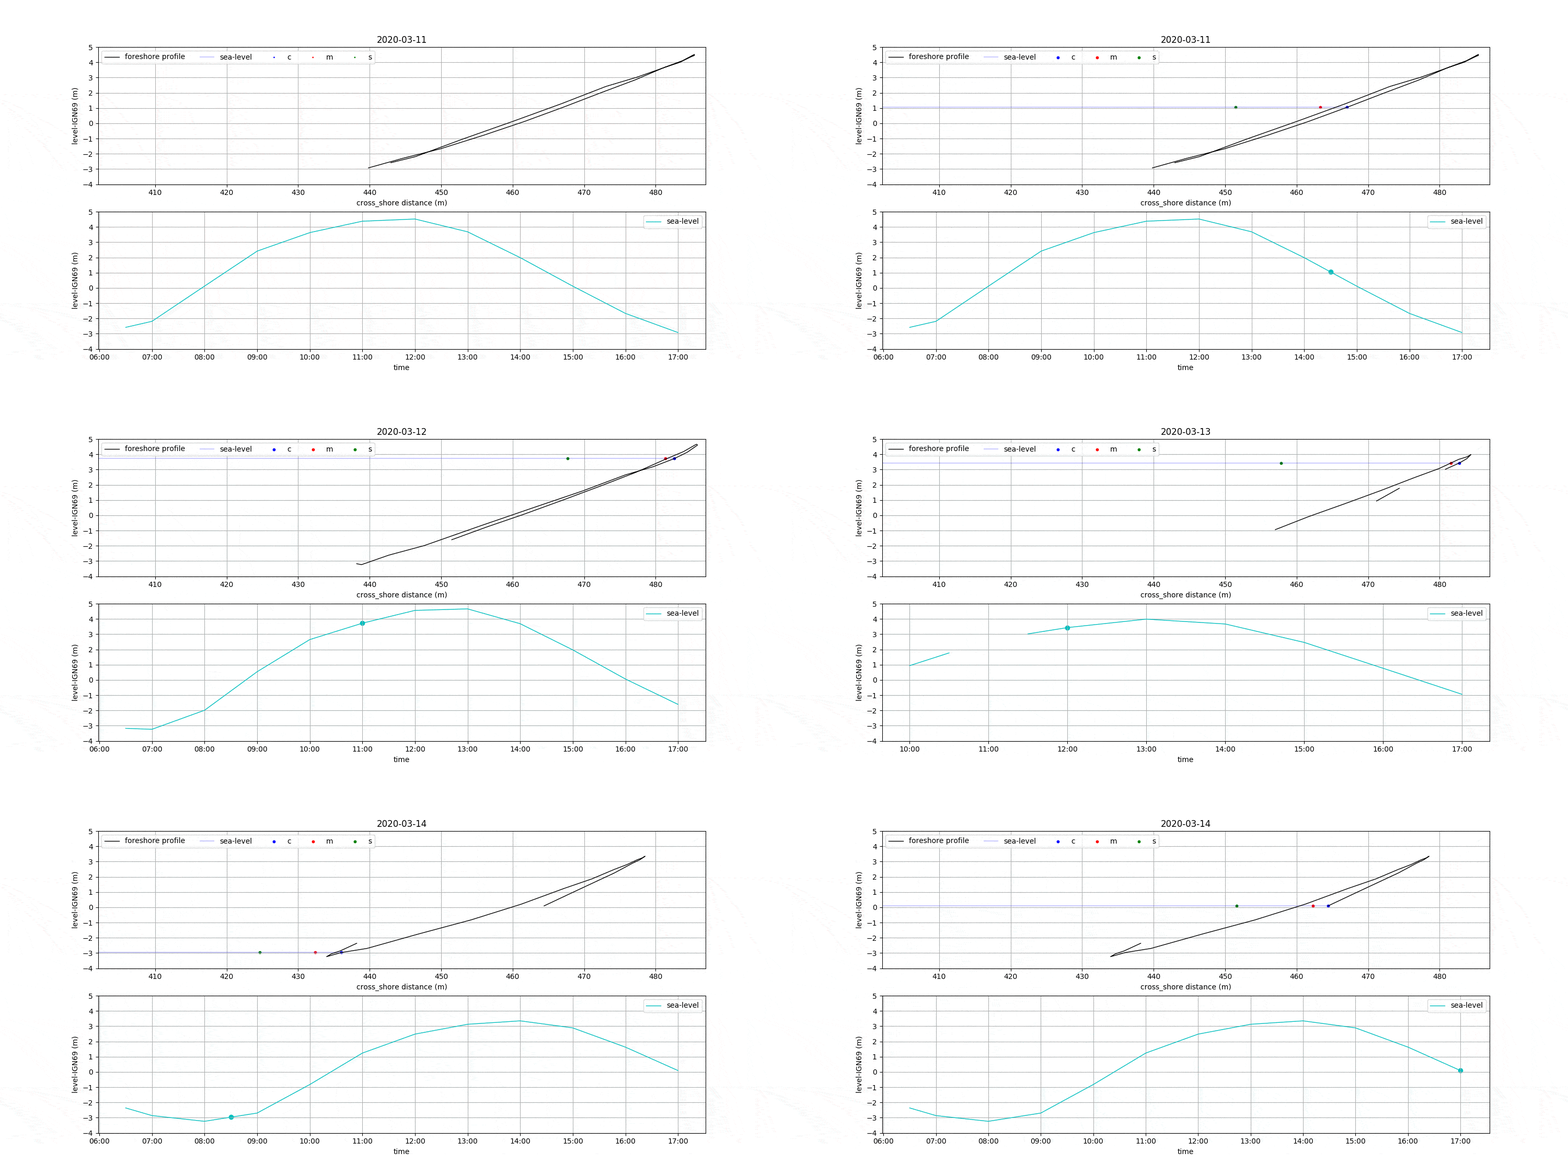
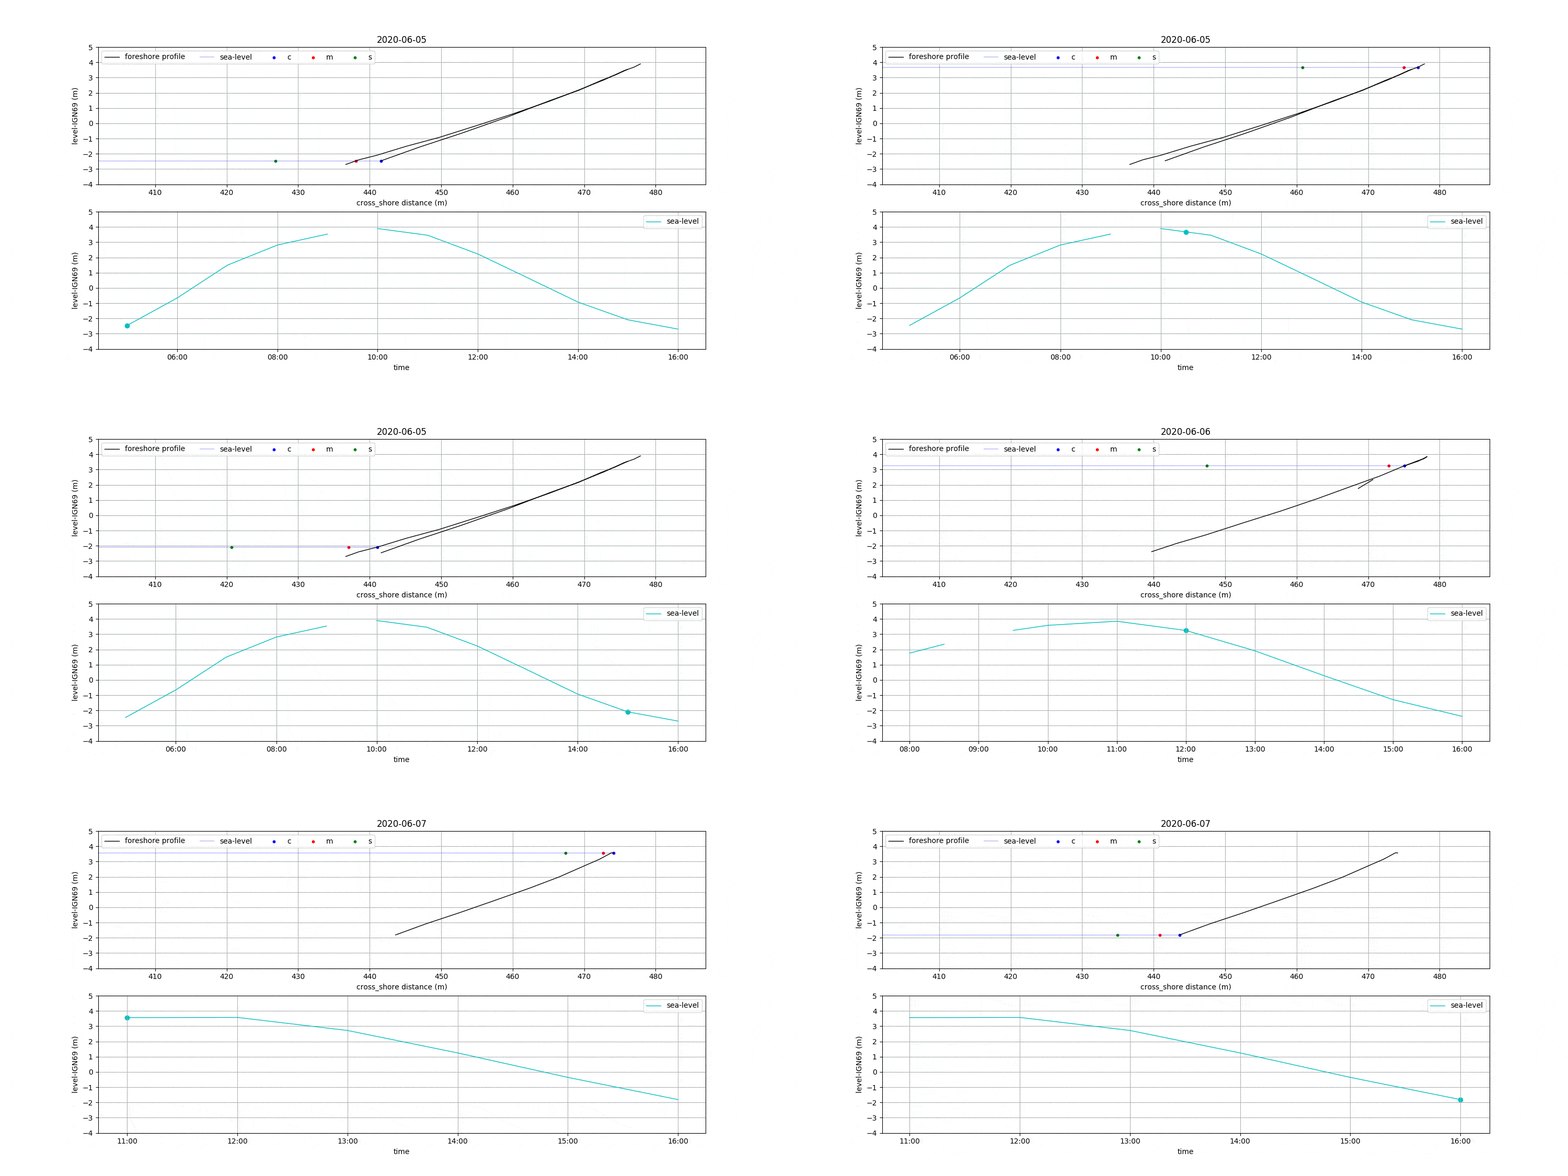
Last but not least, taking advantage of the mean shoreline determination, we can reconstruct the beach profile in the tidal range. (see animations below). This is interesting because there are formulations to determine the risk of flooding depending on the slope of this area. This will undoubtedly be one of our next posts!
That’s all for now! If you find it interesting do not hesitate to contact us and share this article!
