Today we will introduce the temporal dimension of our Time-stack, if you haven’t seen the explanatory video about this useful image yet I invite you to watch it here so you can better understand what we will see next.
When we go to the beach and appreciate the waves our brain automatically interprets the differences in light (light and shadow) as waves that are directed towards us, so we manage to identify patterns on the surface of the sea. If we think about detecting the waves by remote devices, this shadow-light contrast is very useful and interesting to exploit.
As we have seen in the previous post, it is possible to build a space-time image (Time-stack) from the videos recorded by WaveCams.
There are several advantages of having the temporal dimension in an image : a few clues on this video :
Then…?
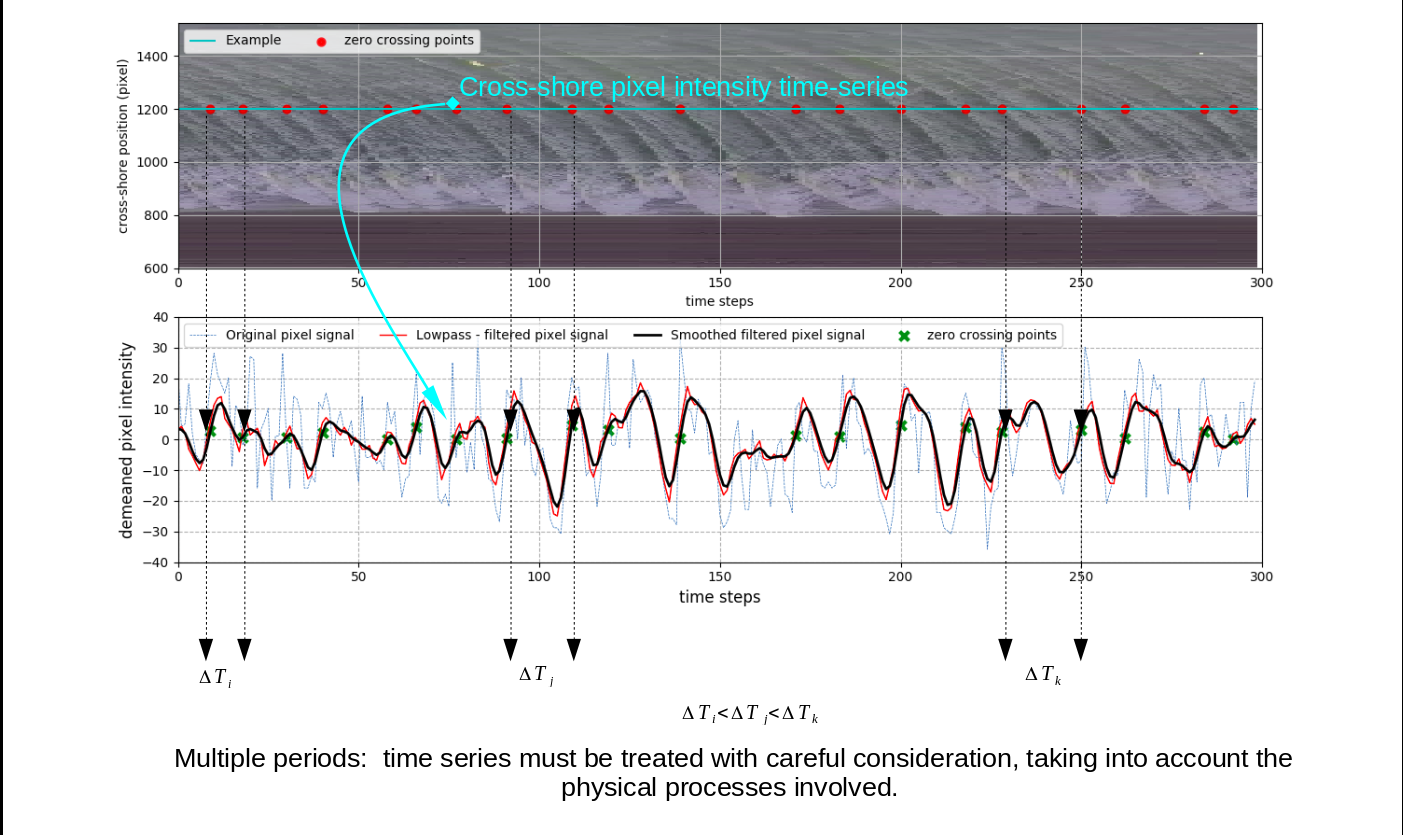
Now, each wave that arrives at the coast can be tracked on a Time-stack. The variation in light intensity that the propagating wave produce is recorded at each pixel position of the line. So if we draw a horizontal line in the Time-stack we can see the “history” of our waves arriving at the coast.

In formal terms we can obtain a time series, from which we can extract a representative value of the wave period, or the different frequency components of the sea state. For this, there are several techniques, ranging from simple peak detection to more complex analysis such as the Fourier transform.
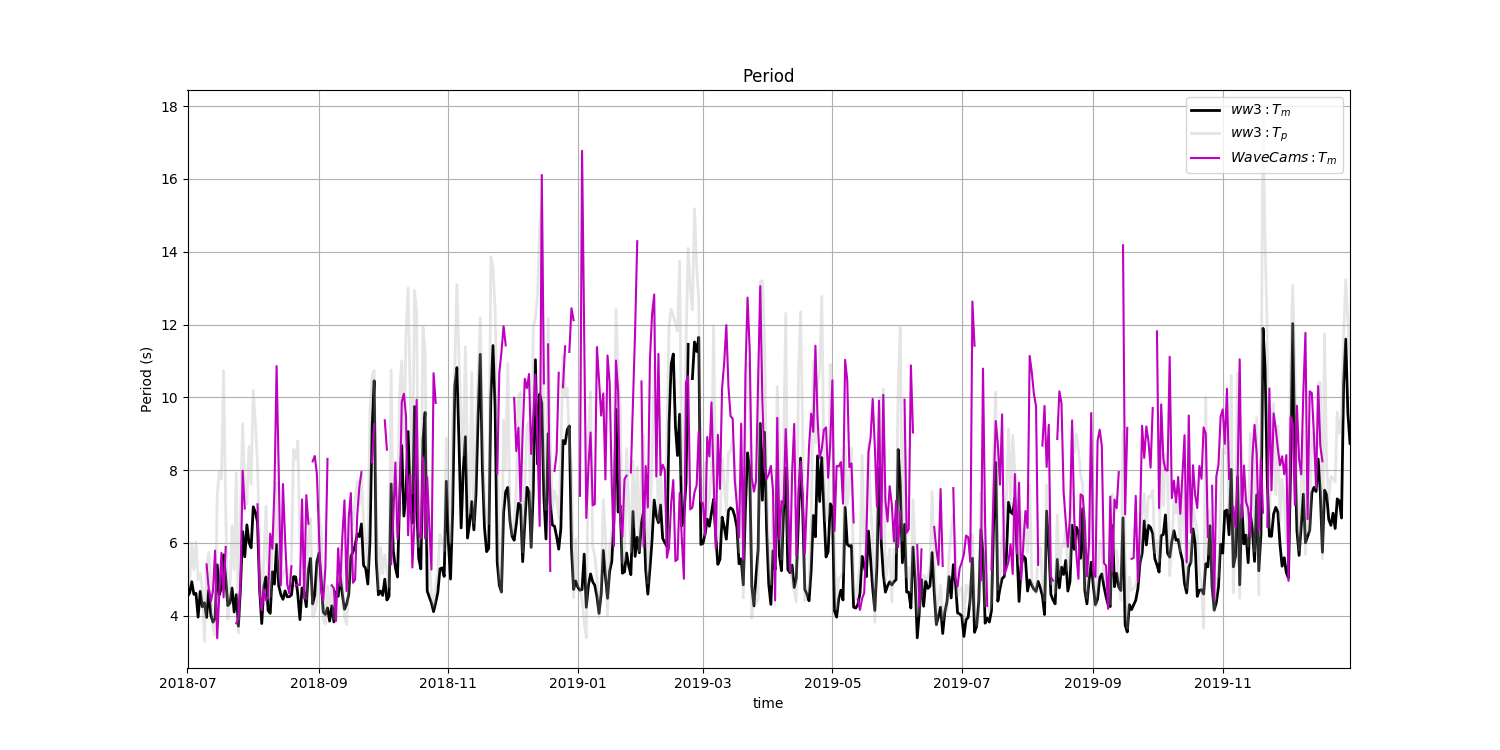
With a fully operational tool (WaveCams®) it is possible to obtain for each recorded time-stack a representative value of the wave period generating time series in the long term.

In this image we see some results of the wave period monitoring at Etretat beach, France from July 2018 to the end of 2019 and its comparison with ww3 model data.
In our next post we will see how we can use the spatial dimension of our Time-stack to obtain an estimation of the wave height.

